cryostat logo
  • Cloud Native
  • OpenShift - Kubernetes
  • Software-Entwicklung

P in temPel

[Application]: Krrk…Base Station, this is Spaceship, do you copy? Over. Krrk…

[Tempel]: Schhks… Spaceship, we read you. Over. Shshkrr…

[Application]: Krrk… We’re experiencing an issue with one of our engines. Over. Krrk…

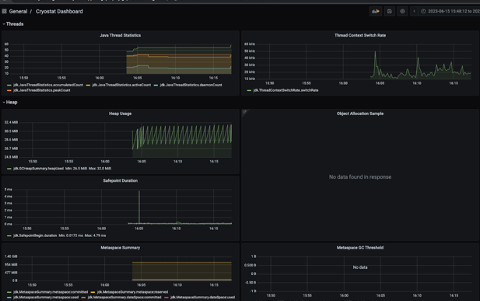
[Tempel]: Schhks… Understood, Spaceship. Let’s see what’s causing this slowdown. We’ll initiate a Java Flight Recording remotely using Cryostat to get to the root of the problem. Please stand by. Over. Shshkrr…

[Application]: Krrk… Copy that, Base Station. We’re standing by. Over. Krrk…

[Tempel]: Shshkrr… Copy, Spaceship. We’ll inform you once we have some results. Over. Schhks…

[Application]: Krrk… Standing by, Base Station. Over. Krrk…

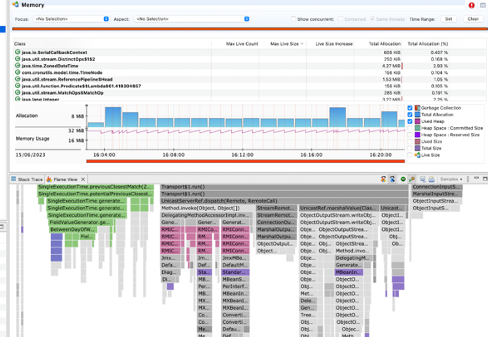
[Tempel]: Shshkrr… Spaceship, our analysis of the Java Flight Recording data points to a function with double nested loops causing the performance issue. We recommend refactoring this function to reduce the time complexity. Over. Schhks…

[Application]: Krrk… Copy that, Base Station. We will initiate the refactor. Over. Krrk…

[Tempel]: Shshkrr… Understood, Spaceship. Let us know if you need further assistance. Over. Schhks…

[Application]: Krrk… Thank you, Base Station. Over and out. Krrk…

Imagine you’re the commander of this base station, applications call in for running slow. Every feature has new slowdowns, and you want to observe how your application performs.

The solution is profiling

Profiling helps us to gather information about our application that we usually wouldn’t see. It provides us with data on the duration of function calls, what is pushed to the stack, what is on the heap, etc. Numerous implementations exist, as it is a concept older than most programming languages. As profiling is tedious, many users opt to implement it when needed. This is the equivalent of making a backup when you need it.

Meet continuous profiling 

Continuous profiling provides us with the power of context and historical data. This lets us see which features are causing slowdowns and provide alerts before our container runs out of memory. Overall, more data means more correlations and – ultimately – better outcomes. We are coming to our Spaceship engine, the JVM.

Since Java 11, there is a feature in the Java Virtual Machine to record what is happening, called ✨ JFR The origins of the Java Flight Recorder can be traced back to Oracle JDK 8, which was made available as open-source by Oracle in 2018. JFR mitigates the black box effect you usually get when running applications. Nonetheless, utilizing them alone can prove to be challenging.

On the other hand, Cryostat is a tool to start a

Cryostat

and stop these recordings. If JFRs are like a video camera, Cryostat would be the remote for that camera. It can control which application for which period should be recorded. JFRs need to be manually started and saved to a specific location. Cryostat does that via the JMX (Java Management Extension) port to the JVM. It simply connects to the „spaceship“ and says, please record a flight recording. When done – in continuous mode after approximately 2 hours – it gets and saves the recording. Therefore, you can look it up anytime. Even if your pod fulfills the inevitable promise of Kubernetes: that it will eventually die.

 Cryostat provides a Grafana data source for simple analysis where you can look up the heap size, thread use, etc.

cryostat dashboard

While it is sometimes useful, the real advantages come with the Java Mission Control (that’s why it’s a space analogy, duuhhh)

With your Mission Control Center, you can explore the depths of your spaceship. This tool enables you to see the various classes in memory and identify where the CPU is being utilized the most. By doing so, you can pinpoint and address any performance issues.

Cryostat Jdk

Cryostat targets Java applications and Java applications only. It is meant to be deployed in a dynamic environment like Kubernetes. Cryostat does an excellent job at keeping up with Kubernetes to check in to see if there are new pods, pods still exist, and so on. Correctly configured, Cryostat notices changes and handles Flight Recordings for these applications accordingly. But should we use it in production? Cryostat is quite a young project, mainly developed by some people at Red Hat. It is a good choice if you do not have Dynatrace, Elastic APM, or something similar in use (looking at you Pyroscope). Flight Recorder comes built-in with Java (native builds excluded), and we already used it successfully for troubleshooting applications. 

However, if you already have one of the big players in place, use them. If you need more insight, start a JFR 🙂

geschrieben von:
Constantin
WordPress Cookie Plugin von Real Cookie Banner