Microprofile Opentracing
  • Tech & Trends

JEE Microservices with MicroProfile-Opentracing

What are the benefits of using MicroProfile-Opentracing

In a microservice environment it is crucial to be able to monitor all services. Tracing allows you to follow a request across multiple services. Additionally to this feature it’s also possible to trace method calls on CDI Beans. Tracing with MicroProfile-Opentracing is fairly easy and doesn’t require much knowledge about the tracing backend and implementations. As with all MicroProfiles, MicroProfile-Opentracing is also not restricted to be used only in microservices but can  also be useful in ordinary WAR/EAR deployments which run on an application server.

Before reading this article, you should read the linked article on the opentracing.io website to get an understanding of the basics of tracing.

How to integrate MicroProfile-Opentracing into an application

The MicroProfile-Opentracing API and it’s implementations such as jaeger are supplied via Maven Dependencies, although these dependencies are provided in different ways, depending on the used application runtime. The following sections explain how MicroProfile-Opentracing is supplied by different application runtimes.

Integration with Wildfly/EAP

The cited dependency has to be added in provided scope. No runtime dependency is needed, because Wildfly/EAP has MicroProfile capabilities already installed as JBoss modules.

<!-- Because you want to trace rest clients -->
        <dependency>
            <groupId>org.eclipse.microprofile.config</groupId>
            <artifactId>microprofile-rest-client-api</artifactId>
            <version>${version.microprofile.rest.client}</version>
            <scope>provided</scope>
        </dependency>

        <!-- Because MicroProfile-Rest-Client is 
             configured via MicroProfile-Config -->
        <dependency>
            <groupId>org.eclipse.microprofile.config</groupId>
            <artifactId>microprofile-config-api</artifactId>
            <version>${version.microprofile.config}</version>
            <scope>provided</scope>
        </dependency>

        <!-- Provides an api for custom server 
             and client side tracing (SpanDecorators).
             WIldfly Module will be referenced during runtime -->
        <dependency>
            <groupId>io.opentracing.contrib</groupId>
            <artifactId>opentracing-jaxrs2</artifactId>
            <version>0.4.1</version>
            <scope>provided</scope>
        </dependency>

        <!-- Provides an api for the TracerFactory, which provides our 
             Tracer to the application and subsystem.
             WIldfly Module will be referenced during runtime -->
        <dependency>
            <groupId>io.opentracing.contrib</groupId>
            <artifactId>opentracing-tracerresolver</artifactId>
            <version>0.1.8</version>
            <scope>provided</scope>
        </dependency>

        <!-- The opentracing api -->
        <dependency>
            <groupId>org.eclipse.microprofile.config</groupId>
            <artifactId>microprofile-opentracing-api</artifactId>
            <version>${version.microprofile.opentracing}</version>
            <scope>provided</scope>
        </dependency>

Configuration

Getting Opentracing to run on a  Wildfly server is not as easy as with Thorntail and Quarkus. Some preliminary works  have to be done to get Opentracing running. In the example accompanying this article I implemented SpanDecorators for server and client side tracing. This setup wouldn’t work because the Opentracing subsystem that is included in Wildfly, which is provided by smallrye, doesn’t set the configured Tracer on the GlobalTracer, which is used by the custom server side and client side tracing. 

The SpanDecorators are supplied by opentracing-contrib a community project for enhancing the opentracing api.

jboss-deployment-structure.xml
<?xml version="1.0" encoding="UTF-8"?>
<jboss-deployment-structure>
    <deployment>
        <dependencies>
            <!-- Because we initialize the Tracer -->
            <module name="io.jaegertracing.jaeger" />
            <!-- Contains api for SpanDecorators -->
            <module name="io.opentracing.contrib.opentracing-jaxrs2"/>
        </dependencies>
    </deployment>
</jboss-deployment-structure> 


TracerFactory discovered via SPI and registered in           
META-INF/services/io.opentracing.contrib.tracerresolver.TracerFactory
     at.ihet.samples.microprofile.opentracing.TracerFactory

Create Tracer from environment as register it on the GlobalTracer
public class TracerFactory implements 
 io.opentracing.contrib.tracerresolver.TracerFactory {

    @Override
    public Tracer getTracer() {
        Configuration configuration = Configuration.fromEnv();
        Tracer tracer = configuration.getTracer();
        GlobalTracer.register(tracer);
        return tracer;
    }
}

    Jaeger configuration either as env vars or system properties
JAEGER_SERVICE_NAME=microprofile-opentracing-wildfly
JAEGER_AGENT_HOST=localhost
JAEGER_AGENT_PORT=6831
JAEGER_REPORTER_LOG_SPANS=true
JAEGER_REPORTER_FLUSH_INTERVAL=2000
JAEGER_SAMPLER_TYPE=const
JAEGER_SAMPLER_PARAM=1

Integration with Thorntail Microservice

Thorntail provides a Maven Bill-of-Materials (bom) which includes the Thorntail fraction for MicroProfile-Rest-Client.

<dependencyManagement>
                <dependencies>
                    <dependency>
                        <groupId>io.thorntail</groupId>
                        <artifactId>bom</artifactId>
                        <version>${version.thorntail}</version>
                        <scope>import</scope>
                        <type>pom</type>
                    </dependency>
                </dependencies>
            </dependencyManagement>

            <dependencies>
                <dependency>
                    <groupId>io.thorntail</groupId>
                    <artifactId>microprofile-config</artifactId>
                </dependency>
                <dependency>
                    <groupId>io.thorntail</groupId>
                    <artifactId>microprofile-restclient</artifactId>
                </dependency>
                <dependency>
                    <groupId>io.thorntail</groupId>
                    <artifactId>microprofile-opentracing</artifactId>
                </dependency>
            </dependencies>

Additionally to the provided dependencies MicroProfile-Opentracing has to tell the system where the tracing backend is, so opentracing knows where to send the traces.

Throntail YAML configuration:
    thorntail:
  jaeger:
    service-name: microprofile-opentracing-thorntail
    agent-host: localhost
    agent-port: 6831
    reporter-log-spans: true
    reporter-flush-interval: 2000
    sampler-type: const
    sampler-parameter: 1

Integration with Quarkus Microservice

Quarkus, like Thorntail, provides a Maven-BOM which provides all Extensions supported by the specific Quarkus version.

<dependencyManagement>
        <dependencies>
            <dependency>
                <groupId>io.quarkus</groupId>
                <artifactId>quarkus-bom</artifactId>
                <version>${quarkus.version}</version>
                <type>pom</type>
                <scope>import</scope>
            </dependency>
        </dependencies>
    </dependencyManagement>

   <dependencies>
        <!-- MicroProfile-Config is standard way of configuring 
          Quarkus, so there is no need for a dependency -->
             <dependency>
                <groupId>io.quarkus</groupId>
                <artifactId>quarkus-rest-client</artifactId>
             </dependency>

        <!-- Quarkus uses smallrye implementation -->
             <dependency>
               <groupId>io.quarkus</groupId>
               <artifactId>quarkus-smallrye-opentracing</artifactId>
             </dependency>

             <!-- Because we initialize the Tracer --> 
             <dependency>
                <groupId>io.quarkus</groupId>
                <artifactId>quarkus-jaeger</artifactId>
             </dependency>

             <!-- Because we use custom server and 
                  client side tracing -->
             <dependency>
                <groupId>io.opentracing.contrib</groupId>
                <artifactId>opentracing-jaxrs2</artifactId>
             </dependency>

             <!-- Because we initialize the Tracer --> 
             <dependency>
                <groupId>io.opentracing.contrib</groupId>
               <artifactId>opentracing-tracerresolver</artifactId>
             </dependency>
   </dependencies>

Additionally to the provided dependencies we need to MicroProfile-Opentracing to tell it where the tracing backend is, so opentracing knows where to send the traces.

src/main/resources/application.properties
quarkus.jaeger.service-name=microprofile-opentracing-quarkus
quarkus.jaeger.sampler-type=const
quarkus.jaeger.sampler-param=1
quarkus.jaeger.agent-host-port=localhost:6831
quarkus.jaeger.reporter-flush-interval=PT2S


How to use Opentracing

When MicroProfile-Opentracing has been set up for the application runtime it’s fairly easy to use in the application.

Creating the Tracer

Dependending on the integration of the MicroProfile-Config in an application runtime the Tracer is either set up automatically or can be set up manually via a TracerFactory implementation which is registered via CDI as the following snippet illustrates. The Jaeger tracing backend is either configured via System Properties or environment variables. There is no other way to configure the backend.

public class TracerFactory implements 
 io.opentracing.contrib.tracerresolver.TracerFactory {

    @Override
    public Tracer getTracer() {
        Configuration configuration = Configuration.fromEnv();
        Tracer tracer = configuration.getTracer();
        GlobalTracer.register(tracer);
        return tracer;
    }
}

META-INF/services/io.opentracing.contrib.tracerresolver.TracerFactory
     at.ihet.samples.microprofile.opentracing.TracerFactory

The TracerFactory is resolved via SPI by the TracerResolver which is provided by the opentracing-contrib-tracerresolver implementation. This approach ensures that the GlobalTracer knows the actual Tracer.

Enhance Information on Spans

There are default implementations which provide data for the trace spans which will not satisfy most of the users’ needs. Opentracing-contrib-jaxrs2 provides the interface io.opentracing.contrib.jaxrs2.server.ServerSpanDecorator which allows developers to decorate the request and response and add additional information to the span as the following code snippet illustrates:

// Server side span decorator
public class ServerTracingDecorator implements ServerSpanDecorator {

    @Override
    public void decorateRequest(ContainerRequestContext 
                                requestContext, Span span) {
      span.setOperationName(requestContext.getUriInfo().getPath());
    }

    @Override
    public void decorateResponse(ContainerResponseContext 
                                 responseContext, Span span) {
        span.setBaggageItem("response.body",    
             JsonbBuilder.create().toJson(response.getEntity()));
    }
}

// Register server side tracing via JAX-RS DynamicFeature
@Provider
public class TracingInitializerFeature implements DynamicFeature {

    private static DynamicFeature tracingFeature = new   
         ServerTracingDynamicFeature.Builder(GlobalTracer.get())
            // Here we register our decorator
            .withDecorators(Collections.singletonList(
                            new ServerTracingDecorator()))
            .withSerializationDecorators(Collections.emptyList())
            .withTraceSerialization(false)
            .withJoinExistingActiveSpan(false)
            .build();

    @Override
    public void configure(ResourceInfo resourceInfo, 
                          FeatureContext context) {
        // Here we register the custom built feature
        tracingFeature.configure(resourceInfo, context);
    }
}

// Client side span decorator
public class ClientTracingDecorator implements ClientSpanDecorator {

    @Override
    public void decorateRequest(ClientRequestContext requestContext, 
                                Span span) {
        span.setBaggageItem("request.body",
             JsonbBuilder.create().toJson(response.getEntity()));
        span.setOperationName(String.format("[%s] %s",
                requestContext.getUri().getHost(),
                requestContext.getUri().getPath()));
    }

    @Override
   public void decorateResponse(ClientResponseContext responseContext, 
                                Span span) {
      String body = "";
      if (responseContext.hasEntity()) {
       body = readEntityFromInputStream(
                     responseContext.getEntityStream());
       responseContext.setEntityStream(new 
          BufferedInputStream( 
               new ByteArrayInputStream(
                   body.getBytes(StandardCharsets.UTF_8))));
       }

        span.setBaggageItem("response.body", body);
    }

    private String readEntityFromInputStream(final InputStream is) {
      try {
          ByteArrayOutputStream bos = new ByteArrayOutputStream(1024);
          IOUtils.copy(is, bos);
          return new String(bos.toByteArray(),StandardCharsets.UTF_8);
        } catch (Throwable e) {
            return "not_readable: " + e.getMessage();
        }
    }
}

The client side span decorators won’t work with declarativ registration of the ClientTracingFeature with MicroProfile-Rest-Client annotations because the feature will have to be built manually to be able to use the decorators.

// Register client side tracing via JAX-RS DynamicFeature
private ExternalRestResource createRestClient() {
   try {
    final ClientTracingFeature feature = createClientTracingFeature();
    return RestClientBuilder.newBuilder()
                    .baseUrl(new URL("http://httpbin.org"))
                    .readTimeout(2000, TimeUnit.SECONDS)
                    .connectTimeout(2000, TimeUnit.SECONDS)
                     // Here we register the custom built feature
                    .register(feature)
                    .build(ExternalRestResource.class);
   } catch (MalformedURLException e) {
    throw new RuntimeException("URI is not valid");
   }
}

private ClientTracingFeature createClientTracingFeature() {
  return new ClientTracingFeature.Builder(GlobalTracer.get())
                .withTraceSerialization(false)
                // Here we register our decorator
                .withDecorators(Collections.singletonList(
                                new ClientTracingDecorator()))
                .build();
}

Trace CDI Beans

MicroProfile-Opentracing specifies the annotation org.eclipse.microprofile.opentracing.Traced where implementations provide an Interceptor to trace method calls on CDI Beans. The only thing that has to be done by the developer is to annotate CDI Beans on class or method level with @Traced and, if intended, to provide a custom implementation of the Interceptor.

@Traced
public class CustomRestResource {
    ...
}

Trace rest clients

Unfortunately MicroProfile-Rest-Client doesn’t integrate with MicroProfile-Opentracing yet, but it’s fairly easy to integrate the opentracing-contrib-jaxrs2 provided ClientTracingFeature into rest clients.

// If span decorators are not needed or you have a custom tracing  feature
@RegisterRestClient(configKey = "externalResource")
@RegisterProviders(@RegisterProvider(ClientTracingFeature.class))
@Path("/")
public interface ExternalRestResource {
   ...
}

// If you want to use span decorators
See code snippet Register client side tracing via JAX-RS DynamicFeature

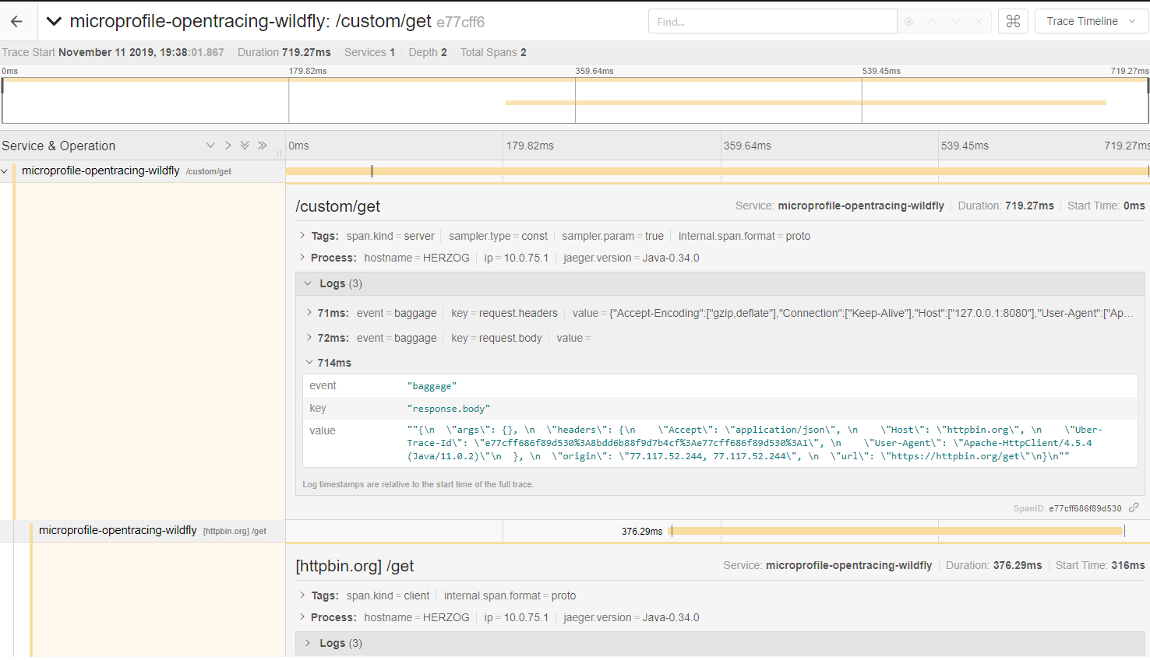
The tracing information is passed between services via an Http Header and the called service can extract the current active span and add its spans as child to it.

Where to analyze traces

So far we have learned how to integrate tracing into our application, how to implement span decorators to provide additional information on the spans and how to trace our application. Now is the point where we want to analyze our traces and this is where Jaeger-UI, which is the backend we send our traces to, comes into place.. 

Jaeger-UI

Jaeger-UI sets up on top of several supported no-sql databases, where the trace data is stored in form of  json objects. The Jaeger-UI displays the trace data and provides filters for many attributes of the traces. The following image shows the Jaeger-UI.

Main page of Jaeger-UI

Specific traces of a service

Sample Application

I have implemented a simple sample application which demonstrates the usage of MicroProfile-Opentracing in a JEE application which is deployable as a microservice for Thorntail and Quarkus or as a WAR deployment in Wildfly.

Useful Links

geschrieben von:
Thomas
WordPress Cookie Plugin von Real Cookie Banner